Submitted by florin on
Moving your infrastructure into the cloud, or thinking to do so? Still using old monitoring tools such as Nagios and Munin? There's trouble for you on the horizon. But there are better ways to do monitoring in the cloud - read on to find out.
This is part 1 of a series of articles:
- Monitoring for the cloud, part 1 - tools and techniques
- Monitoring for the cloud, part 2 - architecture
Nagios was released in 1999. That was a time when infrastructure was mostly static. New servers would be installed once in a while, old servers might get decommissioned sometimes, but for the most part the computing infrastructure did not change much. Machines were meant to be 'permanent'. Losing a server due to disk failure was a significant event. People would actually give individual names to servers - be that characters from a book, or the names of famous places, or whatever.
Nagios reflected that culture. Unless you added a new machine to your monitoring tools, it would not be monitored. And then, when the machine did eventually go the way of the dinosaurs, Nagios would continue to flag it "down" and would send alerts until you (or an automated tool) removed the now decommissioned machine from monitoring. There were ways to construct generic definitions for services and tests, but the bottom line was - each new machine and each new service had to be added as a separate entity.
That world is gone now, or about to go, after the emergence of cloud computing. This is a much more fluid environment. What was previously "servers" is now instances, and these are fungible. Instances are created and destroyed all the time; created when demand goes up, to keep up with increased traffic and computational demands; destroyed when traffic calms down, and extra instances would just waste money and resources. In this paradigm, you are as much attached to an instance as you were to a file in /tmp before.
A monitoring software that could be used easily with this new model should reflect these changes. The software should care less about individual resources, such as instances or services. It should care more about aggregates - this is true for both fault detection (Nagios in the old world) and metrics collection and display (Munin, Cacti). The creation or destruction of any point-resource should not be regarded as significant - that happens all the time anyway. Only the general availability of key services should be critical, and monitored accordingly. Individual metrics tend to lose consistency and fade behind such aggregates as median values, top (or bottom) percentiles, etc. The software should be less focused on individuals, and more on populations. You will be dealing a lot with statistics.
Fault detection for the cloud: Sensu
In terms of fault detection, Sensu is one such software. Unlike Nagios, which tried to do everything at once, the Sensu core - the sensu-server service - is just a plain decision making engine. It listens for events on a message queue, and makes decisions based on settings in the config files.
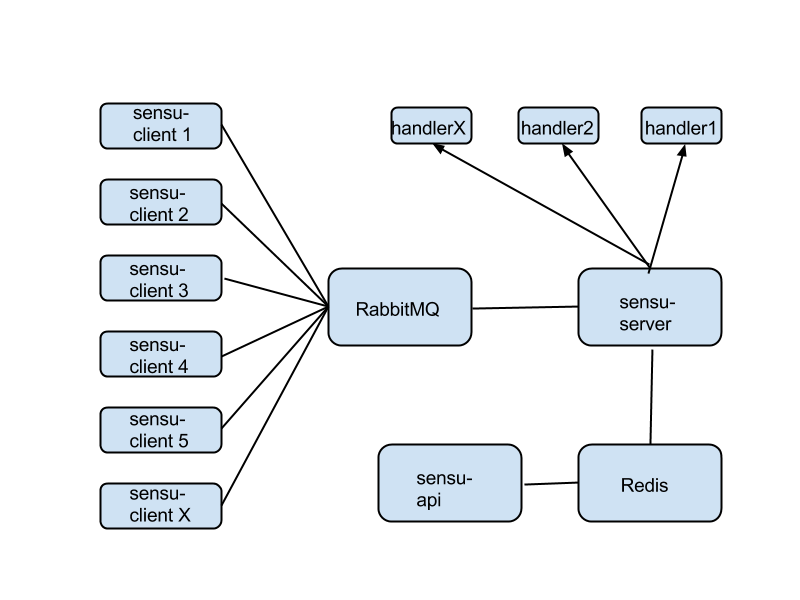
It doesn't care about being connected to agents running on instances - there's RabbitMQ that does that, receiving messages from agents (sensu-client) and dispatching commands from sensu-server back to agents. It doesn't bother to store the state of various checks and clients and so on - it outsources that job to Redis. It doesn't even talk to the outside world directly - there's a separate component, called sensu-api that does that, and it's plugged directly into Redis. To act on the external world, e.g. to send alerts or execute commands, it uses handlers, which are essentially scripts that sensu-server can execute when certain conditions are met.
There's not even a web interface included in the main Sensu software. For that, you should look into Uchiwa, a separate project, that plugs into sensu-api and performs all actions via that route.
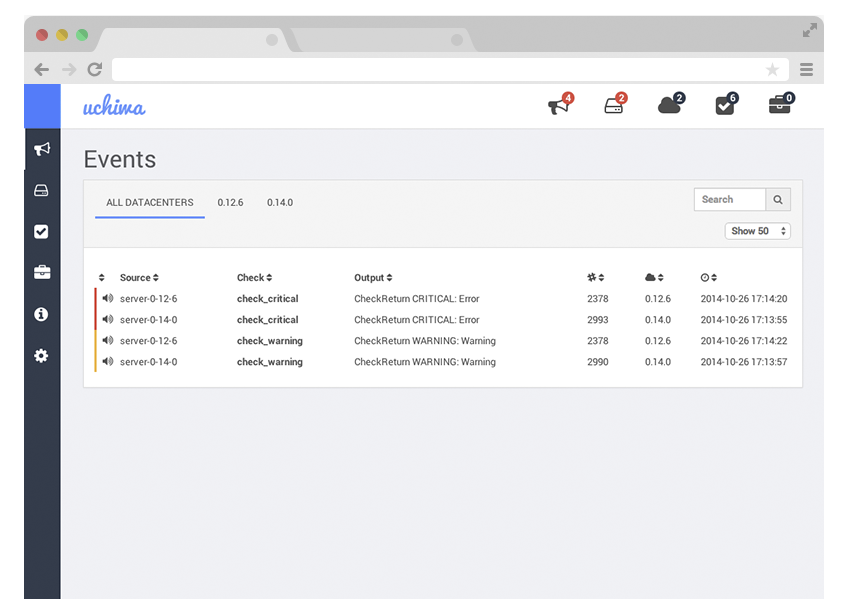
'Do one thing but do it very well' seems to be a main design constraint. Each component does one job only, but excels at it. Compare that to Nagios, which tried to accomplish everything in a single giant executable.
In theory, for a small setup, you could run sensu-client (the agent) on each and every instance you're monitoring, and everything else on a 'monitoring instance'. That's the minimum configuration. But let's say your infrastructure grows. Splitting functionality into separate components has its advantages. Essentially every component can be scaled up in a cluster. Message queue doesn't keep up with traffic to/from clients? Just move RabbitMQ to a separate instance, or even build a RabbitMQ cluster. Same goes for sensu-server - it could run on a separate instance, or as a cluster on many separate instances, splitting the load among cluster members. Redis too could be clustered and load balanced. One of the main limits for growth here appears to be your cloud provider bill, not the performance of the software.
The connections from the sensu-client agents to RabbitMQ are encrypted and authenticated via SSL certificates. You could use a single certificate for all agents if you wish. When new instances are created, they simply self-register by connecting sensu-client to the message queue. Via a template, or a config management software (Puppet, Chef, Ansible, Salt), you could configure various instances with different subscription lists on the sensu core; each client will start executing checks from the subscriptions that they belong to, automatically. E.g., web servers will execute Nginx checks, data backends will execute Cassandra checks, etc. All instances could execute generic OS checks such as disk usage, CPU usage, etc. Just create the right subscription lists on the core, and tie the clients into them via config management or templates.
There's even no need to ping instances to see if they are alive. The sensu-client agents publish keepalive messages on the queue. Absence of a keepalive signal for longer than a certain time indicates some sort of failure, and is roughly equivalent to a failed ping. You could choose to be alerted in that case for some instances - or you could choose to ignore most of the missing keepalives, as instances in the cloud tend to be fungible. A cron job could periodically remove old dead clients via sensu-api on the core.
The best thing is - you don't have to do anything when an instance is created or destroyed. When it's created, it self-registers on the core. When it's destroyed, you generally ignore the missing keepalive (with some exceptions). This is the most immediate and, arguably, the most important difference from Nagios.
Speaking of which - the plugins that execute Sensu checks are essentially Nagios plugins. The same plugin protocol is used here. So you could migrate all your old plugins without problems - or you could write new ones; Ruby is the preferred language, but anything will work, within reason.
The Sensu GitHub repositories, especially the community plugins, have all you need in terms of plugins, handlers, etc. Feel free to write and publish new plugins, but make sure you adhere to the code quality standards of the project; it's easiest if you start with an existing plugin and hack it to make it do what you want. In the first few months of using Sensu, I had 2 or 3 new plugins published into the repo, several changes to various other plugins, plus the experience that comes with that. Do a good job and the community will accept your contributions.
Metrics for the cloud: Graphite
To collect, store, analyze and visualize metrics, same observations apply. In the cloud, you need tools that are fluid, and are designed to deal with collectives and statistics, rather than with individual entities. Old tools such as Cacti or Munin are not designed for that.
Graphite is a metrics software written from scratch with the cloud in mind. Like Sensu, it doesn't care much about individual instances; new instances will self-register (if they pass the credentials check), and will start recording metrics in the right place on the metrics tree, depending on their configuration. When the instance goes away, Graphite just keeps the existing data according to whatever data retention policy you've defined, but it doesn't care that the instance is missing, per se.
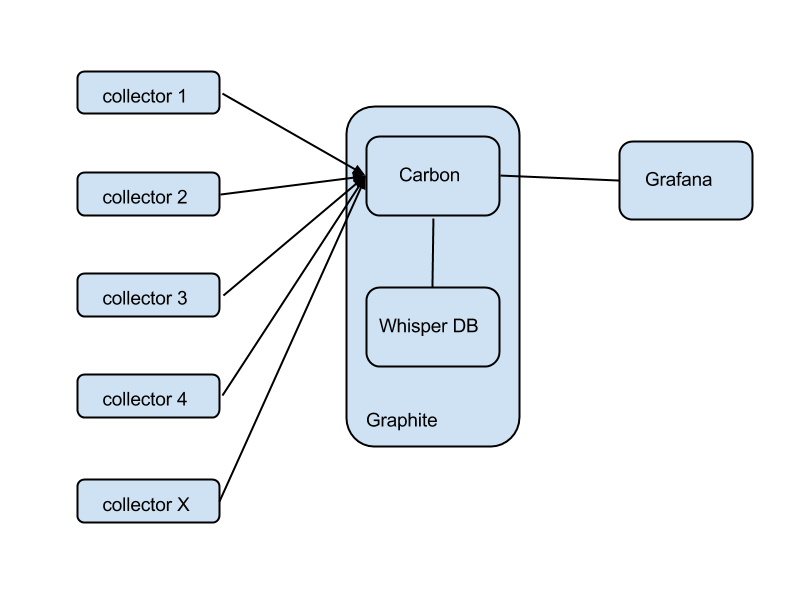
Roughly speaking, there are two main components: Carbon, a set of services dealing with receiving data from collectors, replication and sharding, and interfacing with the outer world; and Whisper, a database written specifically for time-series numeric metrics.
The collectors are agents running on your instances, collecting metrics locally and forwarding them to Graphite. There are many, many different agents that you could use (collectd, statsd, Ganglia, Sensu). This versatility is one of Graphite's strongest points.
To visualize the data, again, there is a plethora of dashboards that you could plug into Graphite and generate graphs, run queries, do aggregates and statistics, etc.
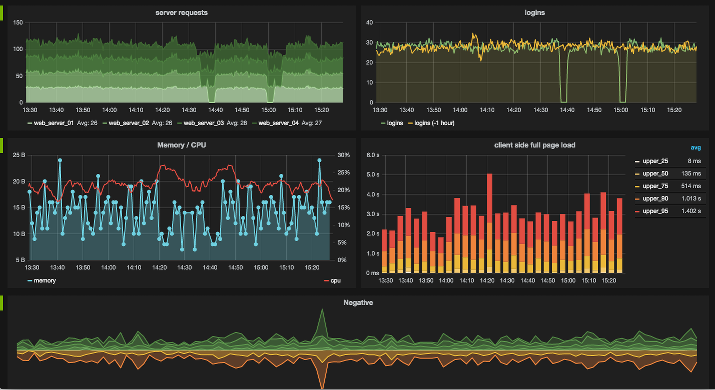
Standing out from the crowd is Grafana, a flexible and powerful dashboard that understands most of Graphite's data processing API, runs in the browser and uses Graphite only as a remote data backend (so you're not stressing your Graphite instance with the lowly job of generating PNGs), and also looks pretty good.
The metrics stored in Whisper are time-series numeric data, only. That means every piece of data will have 3 components: a data path, a timestamp, and the metric itself.
The timestamp has a resolution down to the second. It's stored as Unix time (seconds since Jan 1, 1970 UTC). The metric itself is simply a number.
The data path is just a branch in the data tree that you're building into Graphite. You could have as many tree roots as you wish. E.g.: you could start a separate tree for each cloud provider you're using: aws, google, digitalocean. On the next level, you could have geographies: us-west-1, us-east-1, ap-southeast-2. On the next level, you could have instance group names: webservers, db, mail. Next level - instance ID. Next level, the source of the metrics within the instance: os, nginx, cassandra. Next level, the metric name itself: cpu-user, mem-free, url-hits, etc.
Examples of metric paths:
aws.us-west-1.db.db-0012.os.cpu-user

digitalocean.paris.webservers.www-0045.nginx.url-hits
If a path doesn't exist, it will be created. Configure your collector agents properly when they are launched, and you'll have consistent data trees.
Feeding data into Carbon can be done via several protocols. A collector agent must speak at least one of them. The simplest is the plaintext protocol: simply telnet to Carbon on port 2003 and send a line in the format: datapath metric timestamp. Example:
aws.us-west-1.db.db-0012.os.cpu-user 23 1420412499
For each new metric (each new "leaf" in a data tree) Whisper will create a file on disk. The directory path will replicate the data path for that metric. E.g., the metric in the example above, and all subsequent values, will be stored in:
/path/to/whisper/repo/aws/us-west-1/db/db-0012/os/cpu-user.wsp
You define the data retention policy when you install Graphite. If you're familiar with RRDTools, it's pretty similar, just more flexible. E.g., you could store samples every 1 minute for 1 day, every 10 minutes for a week, every 1 hour for a month, and every 1 day for a year. Older data points will be discarded. Newer data points will gradually filter into the older, lower resolution data areas slowly, as new data keeps coming in.
Since the whole system is optimized for time-series numeric data, performance is very good. Feeding any arbitrary metric into Graphite every 10 seconds, or even faster, is very doable. Don't be afraid to increase frequency; this is not poor old Munin, with one sample every 5 minutes. Collecting hundreds of metrics from each one of dozens or even hundreds of instances is doable even with a single Graphite instance. When performance suffers due to a large volume of data, Graphite is scalable - you can do sharding, etc.
Graphite has a pretty sophisticated set of functions for doing aggregates, statistics, average values, select top X percent, derivatives, etc. Dashboards such as Grafana can use these functions out of the box and build fairly complex and powerful displays.
You could deal with old data paths in several ways. You could just store them forever. You could have some scheme where instance IDs are reused, and so old paths will be revived when new instances are launched matching old IDs. Or you could have a cron job that deletes all paths where there's been no activity in the last X days. Just delete those directories and don't worry about the rest - Whisper will do the right thing.
Logging in the cloud - Logstash
For a long time, when you said 'centralized logging' you thought 'Splunk'. It's a powerful tool, but it can be pretty expensive. Nowadays there are free (as in open source) tools that can deal with log collection, storage and analysis in a fluid environment. For example, the ELK (Elasticsearch, Logstash, Kibana) triad.
Elasticsearch is a distributed, real-time search and analytics engine. Logstash is a tool to collect, parse, index and store logs (using a storage backend such as Elasticsearch). Kibana is a web GUI for Elasticsearch written with logs in mind.
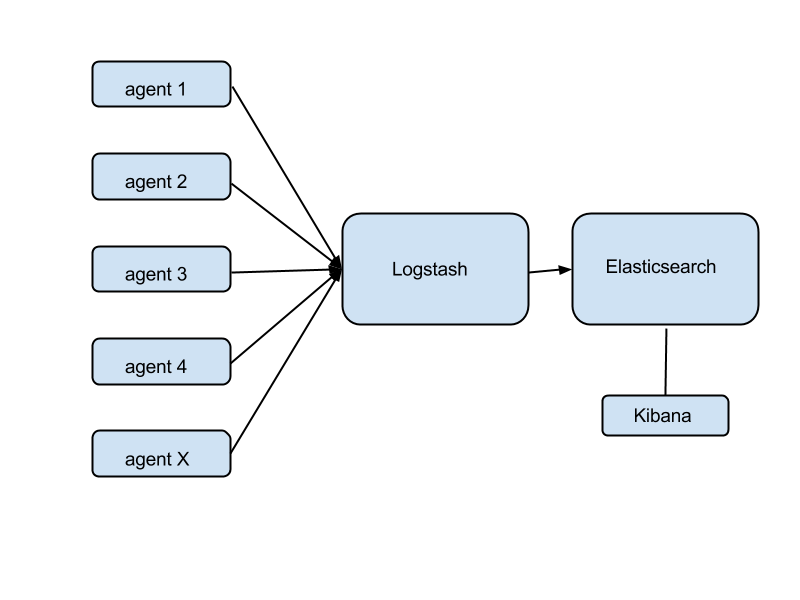
Agents are installed on all instances where you want to collect logs. An agent could be even Logstash in agent mode, but there's a problem with that - Logstash is a Java application, and not a very small one either. That's a lot of RAM wasted in aggregate across your entire fleet of instances. Perhaps a better idea might be Logstash Forwarder (a.k.a. Lumberjack) - a much smaller app written in Go, that does one thing only: collect local logs and forward them to a remote Logstash receiver. Again, the agents could be configured at launch time via a template or via config management.
In many cases, you can secure and authenticate the connection from agents to Logstash via SSL certificates.
Logstash's role is to receive the logs, parse and filter them, and store them in Elasticsearch, while also indexing them by some criteria of your choosing. Once stored in Elasticsearch, you can use this powerful search engine to look for trends, events, even gather metrics and statistics (overlap with Graphite) or detect faults (overlap with Sensu).
When created, instances will start sending logs automatically to your logging core - as long as they have the right certificate, it will Just Work. When destroyed, they stop sending logs and that's it. The data retention policy (cron jobs aimed at Elasticsearch) will decide the fate of the old logs.
Everything is pretty scalable. Elasticsearch can be installed and configured into clusters, with sharding. You could have multiple Logstash receivers if that proves necessary as the number of instances increases. Regardless, a single instance running one Logstash and one Elasticsearch should be able to handle logs from dozens or even hundreds of frontends, depending on the load. When things get slow, scale it up.
Kibana is a human-friendly interface for Elasticsearch, aimed for log analysis. Plug it into your logs backend and start digging into logs. My experience was that the inteface is a little confusing in the beginning, but then it becomes self-evident. It shares a lot of code DNA with Grafana, by the way.
Other tools
Take a look at Riemann. It's nothing less than a paradigm shift for monitoring. It's not only built for the cloud, but it changes monitoring in a fundamental way.
Whereas Graphite is numeric ("how much"), and Sensu is imperative ("when this do that"), Riemann is more semantic. You simply collect a continuous stream of messages from various agents (could be Nginx logs, for example), and on the monitoring core you write complex rules that keep an eye on the aggregate stream. You could extract metrics from it (e.g. web server hits per second), you could send alerts when thresholds are exceeded, or you could even do fault detection - zero logs from your webserver in X seconds means the server is not available, right?
If you're accustomed to traditional concepts in monitoring, it's a bit hard to wrap your mind around it, at first. There's also some functional overlap with other tools, mentioned above. But in a messaging-rich environment, Riemann could provide insight into the functioning of your infrastructure that no other tool can. It all depends on what you're doing.
