Submitted by florin on
There's a cornucopia of tools for monitoring cloud infrastructure: Sensu, Graphite, Logstash, Riemann, etc. The very, very good news is that most of these tools speak each other's protocols. This opens up a lot of possibilities: from small setups where some components (e.g. the message queue) are reused, serving many purposes at once, to complex architectures where the various functions are decoupled, there are large amounts of redundancy at various levels, etc.
This is part 2 of a series of articles:
- Monitoring for the cloud, part 1 - tools and techniques
- Monitoring for the cloud, part 2 - architecture
Consider a classic monitoring job for the cloud - you need to perform:
- Fault detection - monitor various resources and send alerts or execute commands when various thresholds are exceeded, or when services become unavailable
- Metrics collection and display - self-explanatory, gather a steady stream of numbers, store them, show them, watch thresholds, etc.
- Logs collection, storage, analysis
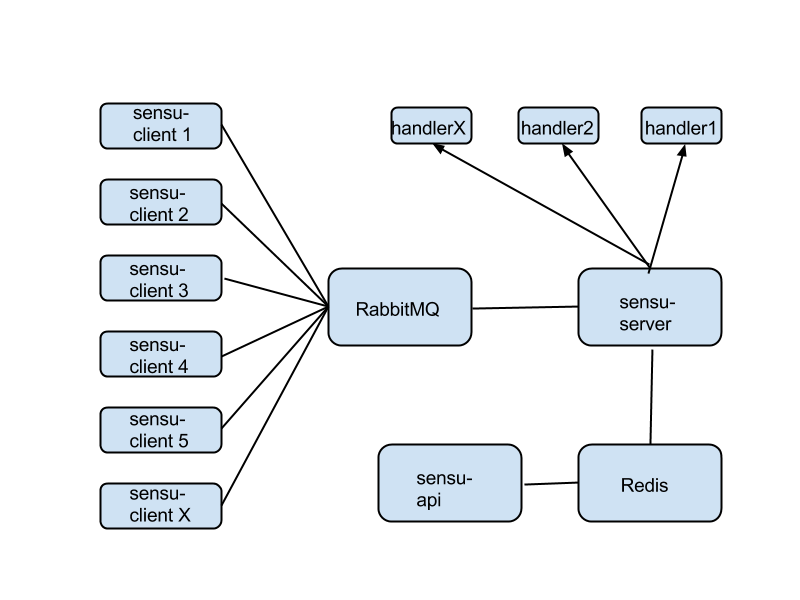
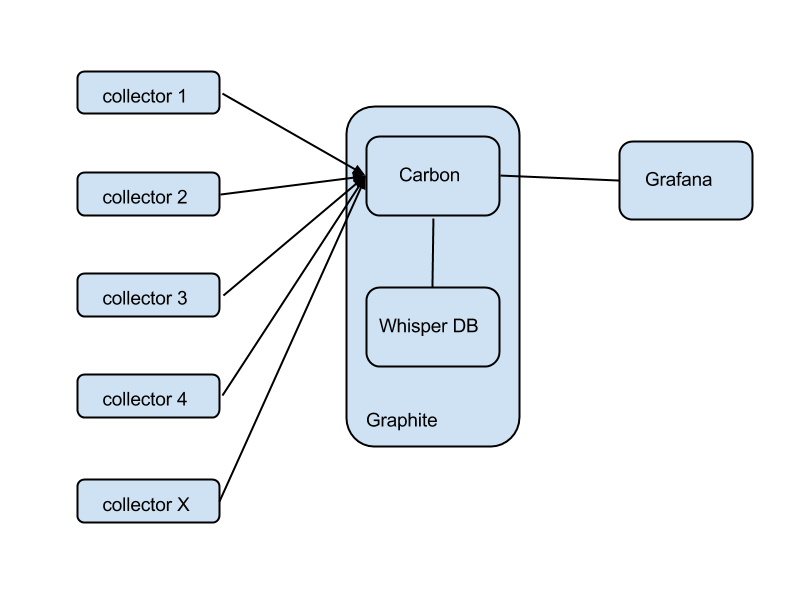
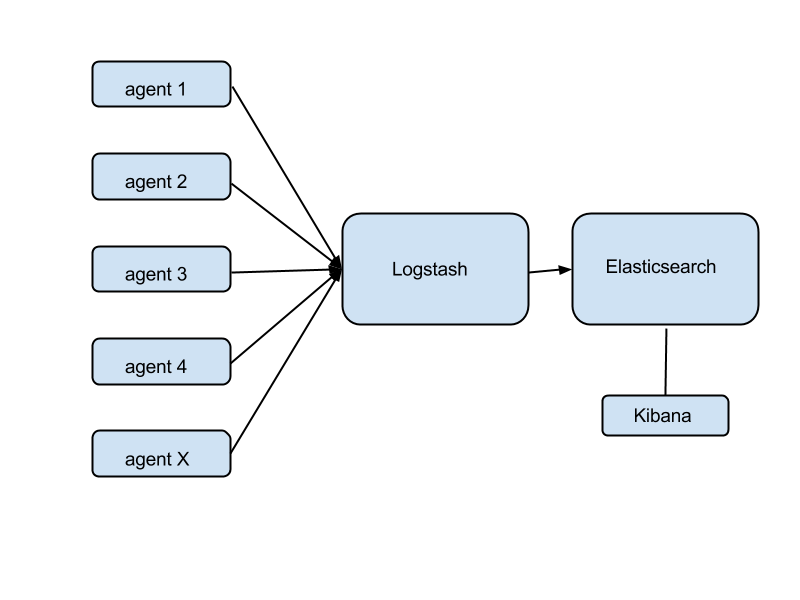
Review the 1st part in this series. Fault detection could be accomplished with Sensu and associated tools. Metrics are Graphite's domain. For logs you could use Logstash.
Full separation
Let's deploy the three groups of tools with no overlap:
What's wrong with the aggregate scheme above?
There's no overlap in terms of agents. You might use sensu-client for fault detection, statsd for metrics collection, and logstash-forwarder for logs collection. This becomes silly when you realize that, for example, you're gathering CPU usage twice: once for fault detection ("alert me when CPU usage goes over 70%") and again for metrics ("collect CPU usage, store its history, display it in a dashboard").
There's no overlap in the core. This is wasteful when your infrastructure is small. In many cases, you could monitor dozens of instances from one single 'monitoring instance' that runs everything: RabbitMQ, sensu-server, Logstash, Elasticsearch, a webserver carrying Grafana, Uchiwa, and everything else. This is not only doable, but actually desirable when your infrastructure is small and there's no reason to waste money on a large, sprawling monitoring core.
It's complex in terms of the number of moving parts. Self-explanatory.
What are the good parts of the example shown above?
Having a separate path for each function gives you superior performance. You will end up splitting the monitoring core like this anyway, if your infrastructure grows very large. If you need to extend any component via clustering, this again makes it easier. It's the high-performance model.
Isolation between different functions means more reliability. You could have RabbitMQ crash and take down Sensu (unlikely, but just for the sake of the argument), and meanwhile Graphite will keep recording metrics as usual.
There's less complexity in terms of density of connections per component. E.g., RabbitMQ is connected to Sensu only. It's easier to understand the configuration and the role of each component in this case.
Maximum overlap
Let's compress the design as much as possible.
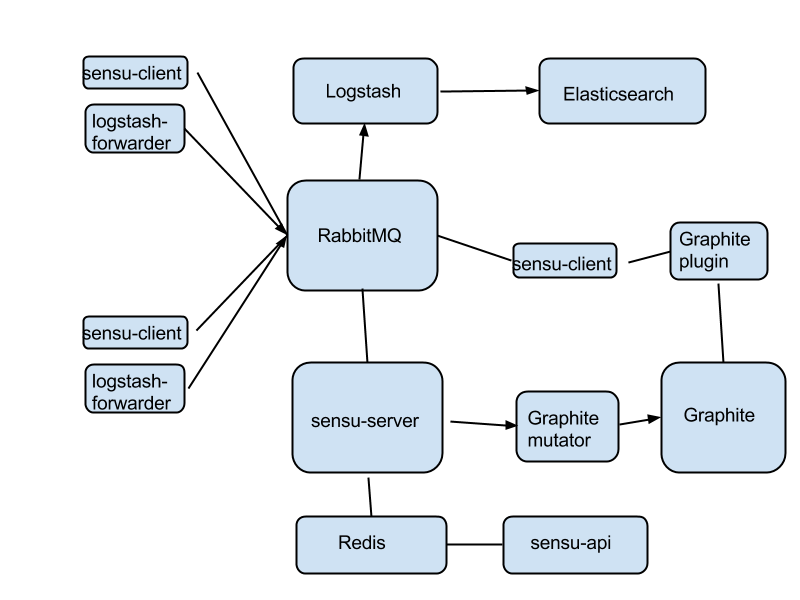
This requires some explanations.
RabbitMQ is the hub of the whole monitoring infrastructure. On each instance, you'll have two agents: sensu-client for fault detection and metrics, and logstash-forwarder for logs. All these agents plug into RabbitMQ.
On the core, again, everything is plugged into the message queue. sensu-server works via RabbitMQ as usual. What's different is that the sensu-client on all instances are now configured to also send metrics back to the server. sensu-server takes these metrics and pushes them into Graphite via the Graphite extension mutator - basically a way for sensu-server to directly push metrics into Graphite.
Then a special sensu-client, installed perhaps on the same instance like sensu-server, uses one of the many Graphite plugins to track various metrics in Graphite. This is how you do fault detection on metrics - you record the metrics first in Graphite, and then run a dedicated sensu-client to track them. Seems convoluted at first, but works well in practice. You can wildcard-match many instances at once, and only alert when some of them exceed the thresholds.
Logstash is also configured to push logs through RabbitMQ - fortunately Logstash speaks AMQP so this is quite easily doable.
What's wrong with this scenario?
Everything is tied into RabbitMQ. If the queue dies, it takes down with it all monitoring. Some redundancy here might alleviate this problem.
There's a lot of complexity in terms of density of connections per component, especially with the message queue.
What are the good parts?
It is as compact as possible. You're running two agents on each instance, instead of three. All the core components could easily fit in a single 'monitoring instance'.
This might be a setup you could start with, when your infrastructure is small, in order to save hosting fees. Gradually, as the infrastructure grows and you need more performance, you could start to split up various components - perhaps move logging to a separate instance (or group), then the message queue, and so on.
Final thoughts
Ultimately, you could build your monitoring infrastructure any way you wish. The tools are very flexible and work well together. It's a bit like building with Lego bricks - there are more ways than one to build that tower.
Because each component can be clustered, when performance decreases, you can determine the bottleneck, split up that component, and give it a separate instance. If that's not enough, cluster up.
There's much more that could be done with these tools. You could have Sensu watch the logs in Elasticsearch and alert if certain things happen. You could install Sensu handlers for various messaging and alerting tools: PagerDuty, Slack, etc.
In order to collapse multiple alerts into fewer messages, take a look at Flapjack - in some cases it might help manage message storms from a misconfigured Sensu.